Getting Started with BackTrack 3 for Basic Wi-Fi Tracing
Published: 06/28/2008
Troubleshooting Wi-Fi problems can be more frustrating than diagnosing issues on wired connections. With the right tools, however, pinpointing connectivity issues can be made easier. Unfortunately, wireless drivers for Windows typically don't allow visibility to the low level where 802.11 frames reside. For a price, tools such as AirPCap, AirMagnet, Omnipeek, etc. are available. But rather than pay the hundreds or thousands of dollars to do this, we look at a much cheaper option - a self-contained Linux distribution called BackTrack that's pre-equipped with many tools and supports a number of common wireless chipsets. And the whole thing's free.
With Linux, having an available driver specific to your wireless chipset that can change from "managed" to "monitor" (RFMON) mode to perform 802.11 sniffing is extremely important. Managed mode is normal operation for most Wi-Fi use since it's required to associate to an access point. The other modes are "master" (if acting as an AP) or "ad-hoc." In most cases, these drivers have been created by reverse-engineering existing drivers on other platforms. For this article, a ThinkPad X60 with an Intel 3945a/b/g chipset is used. The default driver included in BackTrack 3 will allow this network card to perform 802.11 sniffing with just a few commands. BackTrack 3 should also support Intel 2200b/g chipsets out-of-the-box. Some information digging or trial-and-error may be necessary to determine whether your particular wireless card is supported with the right capabilities if it uses a different chipset, and this can potentially be a frustrating experience. YMMV.
This article assumes you have two machines with Wi-Fi cards installed. One machine will boot with BackTrack 3 to view traffic and collect information, while the other will be the machine that the user normally uses and tries to connect to the access point.
Note that you should only observe traffic on networks which you are authorized to freely view (that is, your own). Always ask permission from other network owners first if you wish to scan their traffic. The tools presented in this article are only intended for educational use to learn and expand your understanding of protocols and network behavior.
It is recommended to review the basics of 802.11 to make the most effective use of the tools mentioned here.
Prepare the environment
BackTrack comes as a LiveCD ISO image. There's also an image available to make a bootable USB flash drive, assuming your machine's BIOS supports booting from a USB device (most newer laptops should be able to do this). Get the ISO image here:
http://www.remote-exploit.org/backtrack_download.html
and burn the image file to a CD.
If booting by a USB drive is desired, download the "USB Version (Extended)" ISO image, format a 1 or 2 GB flash drive (FAT32), extract the contents of the ISO image (the two folders named "boot" and "BT3") to the root of the flash drive (using a utility such as WinRAR), then run the bootinst.bat file under the boot folder to write the boot loader code onto the first sector of the flash drive, and then boot the system from this drive. You may need to either update the device boot order within your BIOS (F1 on ThinkPads, F2 on Dells, F10 on HP / Compaqs, etc.) or invoke a manual boot menu during POST (F12 on ThinkPads and Dells, etc.).
Launch the toolkit
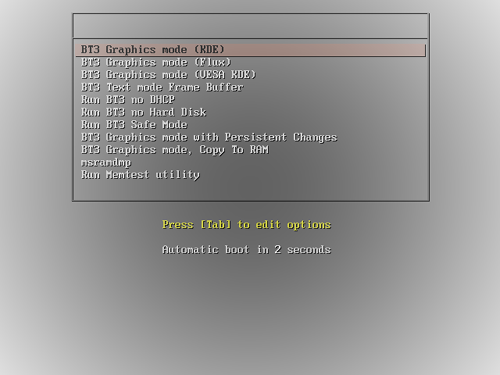
The LILO boot menu is the first thing that's presented. Use the "BT3 Graphics mode (KDE)" option for now.
It takes approximately a minute to boot the OS...
...and desktop logon automatically happens as root. It's simple, and kind of pretty.
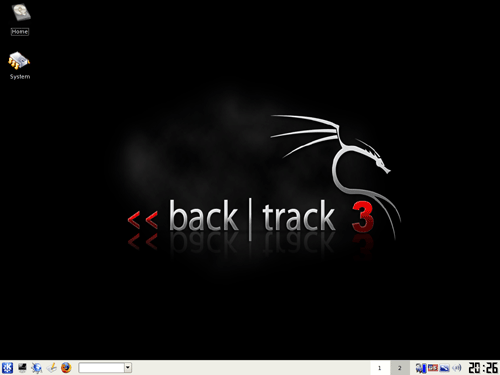
This is a non-persistent environment so any changes made to the desktop (saving files, etc.) will be purged upon shutdown. Open a terminal window (the black "screen" icon towards the lower-left of the K-menu). On the command line, type in ifconfig -a to see all interfaces:
    eth0      Link encap:Ethernet  HWaddr 00:16:D3:39:2E:43
              BROADCAST MULTICAST  MTU:1500  Metric:1
              RX packets:0 errors:0 dropped:0 overruns:0 frame:0
              TX packets:0 errors:0 dropped:0 overruns:0 carrier:0
              collisions:0 txqueuelen:1000
              RX bytes:0 (0.0 b)  TX bytes:0 (0.0 b)
              Base address:0x2000 Memory:ee000000-ee020000

    lo        Link encap:Local Loopback
              inet addr:127.0.0.1  Mask:255.0.0.0
              UP LOOPBACK RUNNING  MTU:16436  Metric:1
              RX packets:0 errors:0 dropped:0 overruns:0 frame:0
              TX packets:0 errors:0 dropped:0 overruns:0 carrier:0
              collisions:0 txqueuelen:0
              RX bytes:0 (0.0 b)  TX bytes:0 (0.0 b)

    wlan0     Link encap:Ethernet  HWaddr 00:19:D2:09:2C:03
              BROADCAST MULTICAST  MTU:1500  Metric:1
              RX packets:0 errors:0 dropped:0 overruns:0 frame:0
              TX packets:0 errors:0 dropped:0 overruns:0 carrier:0
              collisions:0 txqueuelen:1000
              RX bytes:0 (0.0 b)  TX bytes:0 (0.0 b)

    wmaster0  Link encap:UNSPEC  HWaddr 00-19-D2-09-2C-03-00-00-00-00-00-00-00-00-00-00
              BROADCAST MULTICAST  MTU:1500  Metric:1
              RX packets:0 errors:0 dropped:0 overruns:0 frame:0
              TX packets:0 errors:0 dropped:0 overruns:0 carrier:0
              collisions:0 txqueuelen:1000
              RX bytes:0 (0.0 b)  TX bytes:0 (0.0 b)
With the given hardware in this scenario, the wireless interface is labeled wlan0. If other chipsets (non-Intel) are involved, it may be named different. To view the interface and its wireless characteristics, use the command iwconfig wlan0 (don't confuse this with "ifconfig"):
    wlan0     IEEE 802.11g  ESSID:""  Nickname:""
              Mode:Managed  Frequency:2.412 GHz  Access Point: Not-Associated
              Tx-Power=27 dBm
              Retry min limit:7   RTS thr:off   Fragment thr=2346 B
              Encryption key:off
              Power Management:off
              Link Quality:0  Signal level:0  Noise level:0
              Rx invalid nwid:0  Rx invalid crypt:0  Rx invalid frag:0
              Tx excessive retries:0  Invalid misc:0   Missed beacon:0
Notice that this interface is currently in managed mode. Before we go any further, we need to figure out which channel our access point is operating on. Run the wlassistant command to open the Wireless Assistant utility.
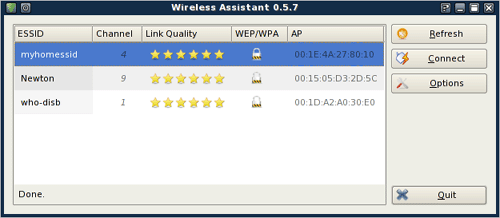
Note the line which lists your SSID and the channel the access point is using. In this case, the access point of interest is running on channel 4. Once the radio channel is known, shut down the wireless interface using the command iwconfig wlan0 down so the mode can be changed.
Configure the interface to operate in monitoring mode by using the command iwconfig wlan0 mode monitor. This will allow the interface to discreetly see 802.11 frames without having to associate to any node. Bring the interface back up with the command ifconfig wlan0 up. Then if you type iwconfig wlan0, the new mode status of the wireless interface is displayed:
    wlan0     IEEE 802.11g  Nickname:""
              Mode:Monitor  Frequency:2.412 GHz  Tx-Power=27 dBm
              Retry min limit:7   RTS thr:off   Fragment thr=2346 B
              Encryption key:off
              Power Management:off
              Link Quality:0  Signal level:0  Noise level:0
              Rx invalid nwid:0  Rx invalid crypt:0  Rx invalid frag:0
              Tx excessive retries:0  Invalid misc:0   Missed beacon:0
Change the channel the wireless interface is listening to with the command iwconfig wlan0 channel 4.
The packets that your next door neighbor can see
Now launch Wireshark by typing in wireshark & in the terminal window.
On the file menu, go to View » Packet Bytes to uncheck the option - this reduces the number of panes during capture viewing and increases visible real estate within the application. Then go to Capture » Interfaces, and click on Start (representing the wlan0 interface).
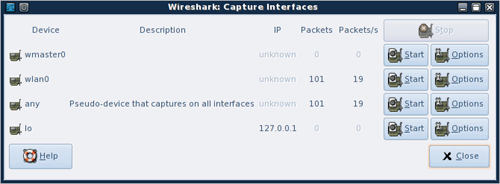
Wireshark is now capturing traffic than the wlan0 interface sees on channel 4. The first thing that will be obviously noticeable in the packet list pane is the amount of traffic created by all the beacons being transmitted 10 times a second from every access point within range. These can be filtered from display as-needed. The following are some filters for isolating specific 802.11 traffic:
(no) 802.11 Beacons:
!(wlan.fc.type_subtype == 0x08)
802.11 Authentication:
wlan.fc.type_subtype == 0x0b
802.11 Association Request and Response:
(wlan.fc.type_subtype == 0x00) or (wlan.fc.type_subtype == 0x01)
WPA 4-way handshake:
eapol.keydes.type == 254 (you can also use eapol)
These filters are entered in the Filter field under the file menu in Wireshark. If the syntax is correct, the field will turn green. Otherwise, it will remain red.
![]()
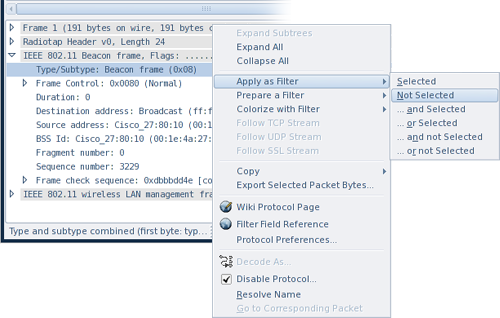
Filters can also be created on-the-fly by right-clicking an item in the packet details window and applying them:
When diagnosing Wi-Fi connectivity issues, ensure that:
1) the wireless network card that's in monitor mode is set to the correct channel (the Radiotap header information contains the operating channel number); if necessary, change the channel setting during live capture by using the iwconfig command.
2) the access point is sending out beacons.
3) the 802.11 Authentication and Association frames are being transmitted by both the station and access point (note the success or failure status codes).
4) if WPA is configured, the 4-way handshake should occur after the 802.11 Association Response is sent to the station from the access point.
To manually reduce the size of the display font, hold down Control while pressing Minus ("-").
Summary
Casual Wi-Fi troubleshooting typically relies on interpreting the simple readings from individual supplicants, such as that from XP's Wireless Zero Configuration, ThinkVantage Access Connections, Intel PROSet Wireless, etc.. However, these results only provide vague clues such as visible SSIDs, general signal strength indications, etc.. None of them provide sufficient, real-time feedback as to what's occuring during connection attempts when the user clicks on the Connect button. Being able to see the packets as the traffic takes place provides visible proof at the location of the sniffer.
Note that this article is not intended as a comprehensive packet tracing tutorial or a how-to on using a sniffer. For more information about using Wireshark, see their website documentation.
Go back to the main articles list.