SolarWinds Real-time NetFlow Analyzer Quickstart
Published: 01/11/2010
"The Internet is slow." This is what users say in their Sev 1 tickets. You have this urge to correct their statements by saying, "You mean the Internet connection seems slow," but you realize (from experience) that it would fall on deaf ears. Trying to correct these semantics is like trying to row your boat against a thirty-foot tidal wave. Just give it up and go back to work.
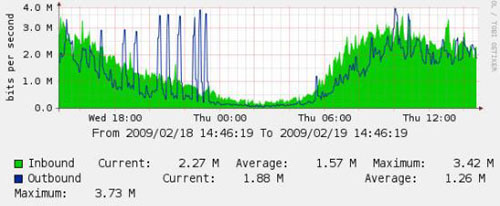
Back in the MDF, you have screens that display colorful graphs which show bandwidth utilization for every single router and switch port in your infrastructure. You notice that the outside router's interfaces bandwidth utilization is way up. Much more than normal. Great, someone is watching non-business-related high-resolution video over the Internet. Or maybe someone installed P2P software and taking advantage of the corporate DS3 again. Or a number of machines on the inside network are compromised and are sending large volumes of spam.

But the graph only tells you so much. You want to know who is causing that traffic. Maybe it's more than one person. Maybe it's an entire department. You need more information to be able to point the finger and unleash the Network Admin Smackdown. Since the economy is sluggish and management has decided that there are no raises, bonuses, equipment support contract renewals, or software purchases this year, IT has to make do with less.
You need something that works with NetFlows. How about...
SolarWinds Real-time NetFlow Analyzer
Free is good, although the paid version offers more. Assuming your Cisco IOS version supports it, you simply enable the NetFlow feature on the device and interface(s), set up a quick read-only SNMP community, install the free (but somewhat limited version of) SolarWinds NetFlow Traffic Analyzer, and start looking at the results. It takes just a few commands on the router and a software install on a Windows client machine.
Configure the router
In this example we quickly set up NetFlow on a Cisco 2611. In the global config mode:
snmp-server community cornflakes RO ip flow-export source FastEthernet0/0 ip flow-export version 5 ip flow-export destination 172.16.0.21 2055 |
where 172.16.0.21 is the client station you will be installing the SolarWinds software and 2055 is the default listening port that the software captures the traffic information from the router. Then go into the interface mode (in this case, FastEthernet 0/0):
interface FastEthernet0/0 ip flow ingress ip flow egress |
There. Done. Next.
Install the NetFlow Analyzer software and start capturing
Installing the software is just like any other software-installing experience. You run the executable with administrator-level privileges, click Next, Next, Next, etc.. Of course, like a responsible IT admin you read every single word in the EULA, consult with your corporate legal counsel to ensure there are no issues, and proceed with the install. Once done, you run the app and are presented with an opening dialog with three options. You've already done the first part, and although you could use the free SolarWinds NetFlow Configurator to do this instead, real admins don't click. We like to type things into a "command line environment" because it sounds mysterious and adds credibility to the difficulty of our work. So we click Close. Then we add a device to monitor by going to Tools -> Add NetFlow Device.

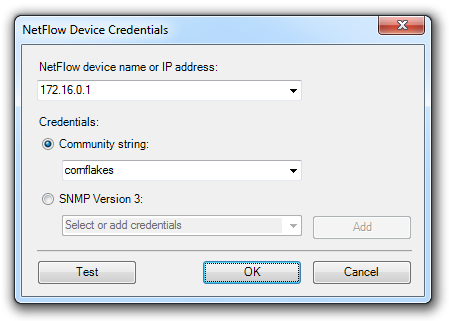
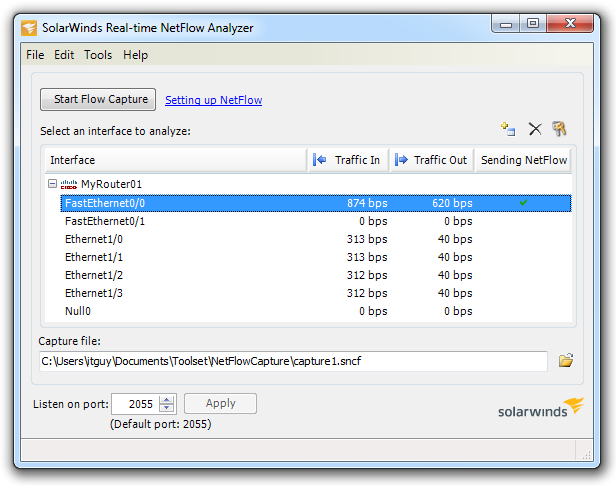
172.16.0.1 is the router's IP and the SNMP community string is the same as the one we configured earlier. If you already have a working IP connection to the router, clicking the Test button will confirm SNMP connectivity. After clicking OK, the router and its interfaces are listed in the main window. The NetFlow-enabled interface will have a green checkmark (shown below in the highlighted line).

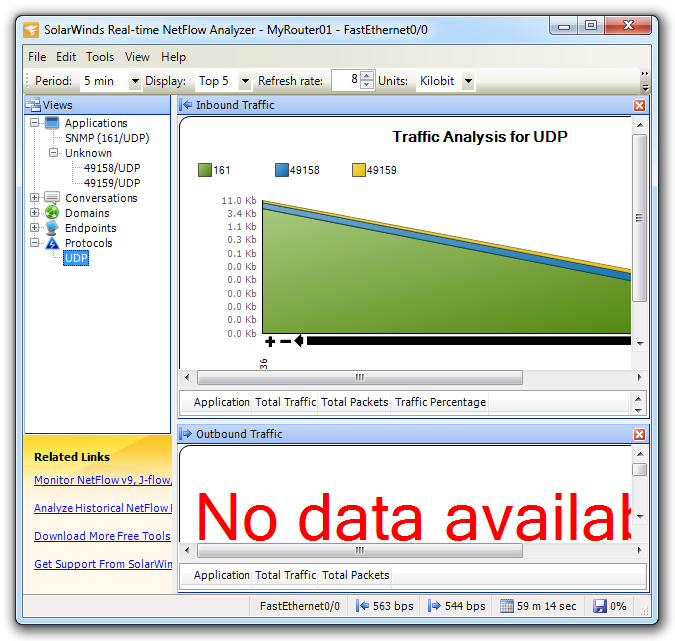
Press the Start Flow Capture button and a new window will show up. Within a minute or two, depending on the amount of traffic passing through the NetFlow-enabled interface, various traffic types and endpoints will start appearing in the left pane. This will help narrow down details, especially in the Conversations categories. The capture time limit is one hour.

Hunt down the bandwidth hog
Assuming the "malicious" traffic happens as the capture is taking place, eventually evidence will start showing up. A little investigative work will reveal who is talking to where using what kind of protocol. Although this isn't the same as deep packet inspection nor does it provide packet-by-packet visibility, you can be better armed to confront that sales guy downloading all kinds of NSFW material during business hours.
Go back to the main articles list.